The UK's price statisticians collect around 180,000 prices a month across a basket of over 700 items. Most of those prices are simple. A loaf costs more or it does not. The hard cases are the ones where the loaf quietly changes.
Why quality changes complicate inflation measurement
A consumer price index (CPI) is meant to follow what it costs to buy the same things over time. The Office for National Statistics (ONS) says its CPI aims to price like for like, so changes in quality or quantity are removed and only genuine price change is captured. That is the goal. Reaching it is messy.
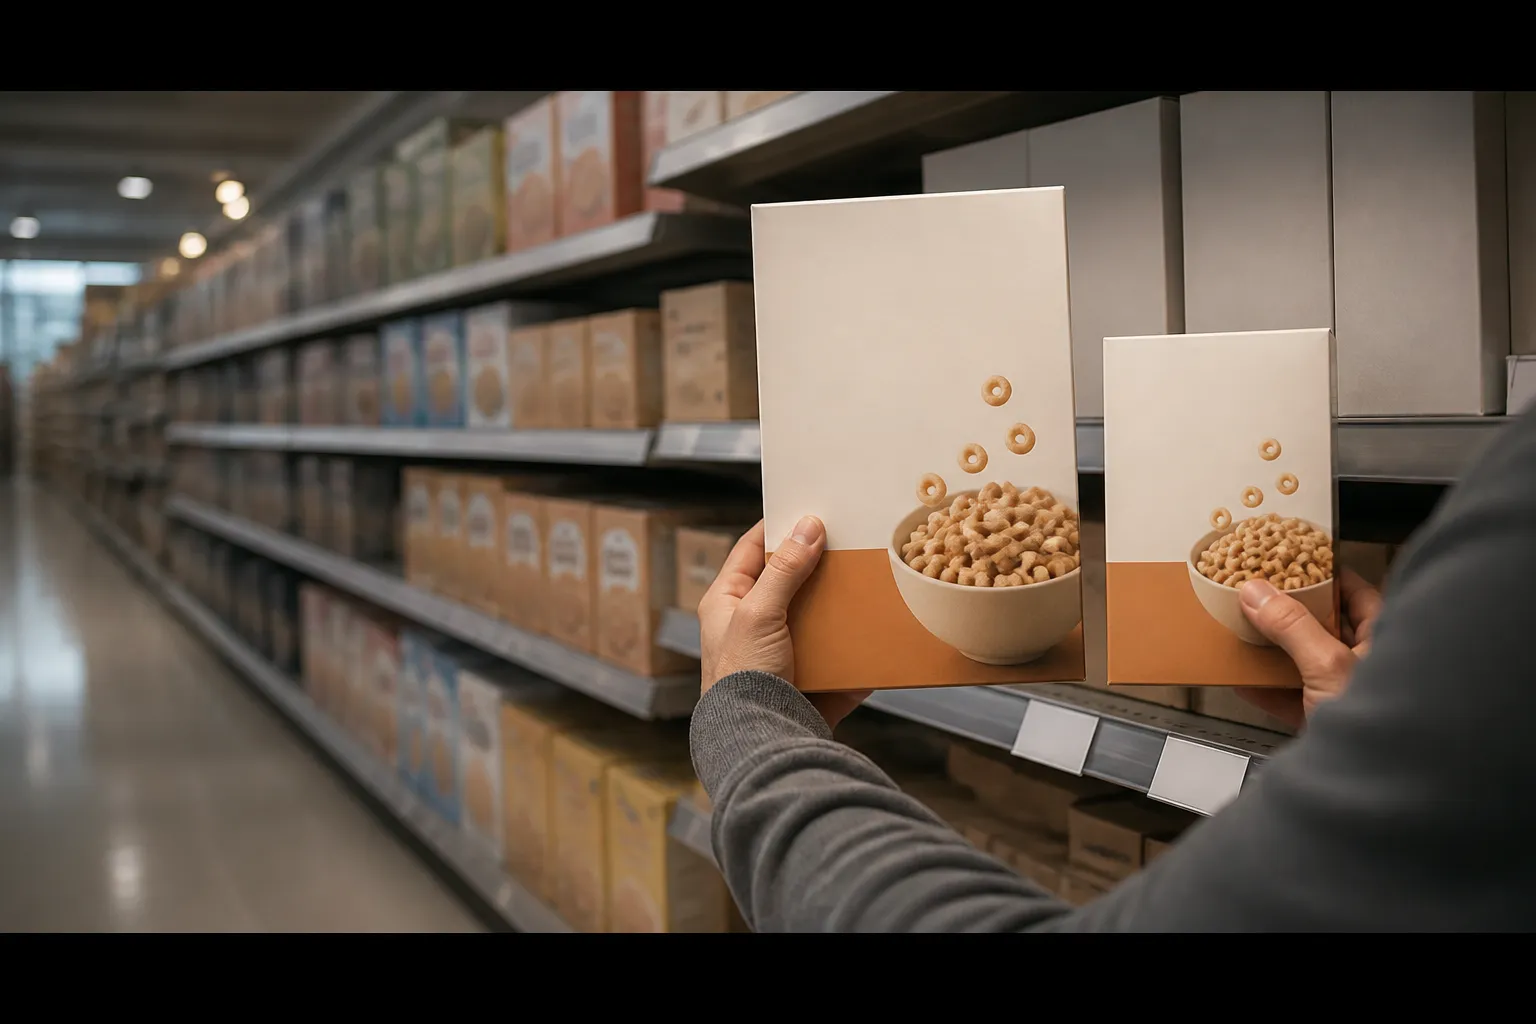
Think about a grocery aisle. A bag of chips drops from a larger size to a smaller one at the same sticker price. Or a phone plan adds a feature and raises the bill by a few dollars. Is that inflation, or is it a different product? An agency has to decide, item by item. Skip the step and the index would read every shrunken package or added feature as a pure price move.
How the like-for-like comparison works
Each period, collectors compare the current version of an item with the earlier one. Differences in cover, features or quantity are taken out of the price calculation. What is left should reflect the price of a comparable product.
The ONS offers an insurance example. If an insurer adds or removes cover, or raises the excess (the amount you pay before a claim kicks in), that is treated as a quality change. It does not show up in CPI as a price change. A household may well feel a higher excess as a cost. The index does not.
Some items resist direct comparison. Live music admission is one. The ONS splits it into groups such as major venues, festivals and other venues, so prices are compared among offerings that are more alike. The agency also withholds exact collection dates, locations and brands, to prevent anyone from gaming the prices.
Hedonic methods and newer approaches
Hedonic methods put a value on product characteristics. If buyers pay more for a faster processor or a bigger screen, statisticians can estimate how much of a price change reflects those features and how much is pure price movement. The US Bureau of Labor Statistics (BLS) publishes frequently asked questions on hedonic quality adjustment and a review of hedonic techniques for products with rapid and complex quality change. Both are good starting points for the technical detail.
A paper in the American Economic Review, Quality Adjustment at Scale, compares hedonic methods with exact demand-based price indices. It describes a hedonic superlative approach that pairs feature values with index formulas, and it needs item-level price and spending data. The authors report that approaches accounting for quality change and consumer substitution can produce lower inflation measures than traditional official methods. That is a finding to read with some care. It describes research methods, not a verdict on any published series.
Why the numbers can disagree and what to ask
Two inflation figures can differ without either being wrong. A private measure may count fees, higher excesses or shrinkflation (smaller packages at the same price) as price increases. An official index may treat them as quality changes. So when you see a claim, two questions help:
- Does it count a shrinking product or a higher fee as a price increase, or as a quality change?
- Is it a traditional official index, or a newer quality-adjusted measure?
Revisions matter too. RBC Economics describes a Bureau of Economic Analysis update to the PCE deflator, a price gauge the Federal Reserve watches. It is expected to lower annual core PCE by about 18 basis points, with July core PCE revised from 3.3% to 3.1%. RBC calls it a retroactive revision, not a disinflationary signal. A basis point is one hundredth of a percentage point. Prices in the shop did not change. The yardstick did.
There are limits here. The ONS material covers the UK CPI. The BLS pages supplied are mostly navigation, so the sources do not show exactly how the US CPI applies hedonic adjustment, and they give no US examples, weights or dollar figures. They also do not say how a household can check quality effects in its own budget. For that, read the BLS quality adjustment page and its methodology pages, or ask a qualified professional about your own situation. This article is educational only.