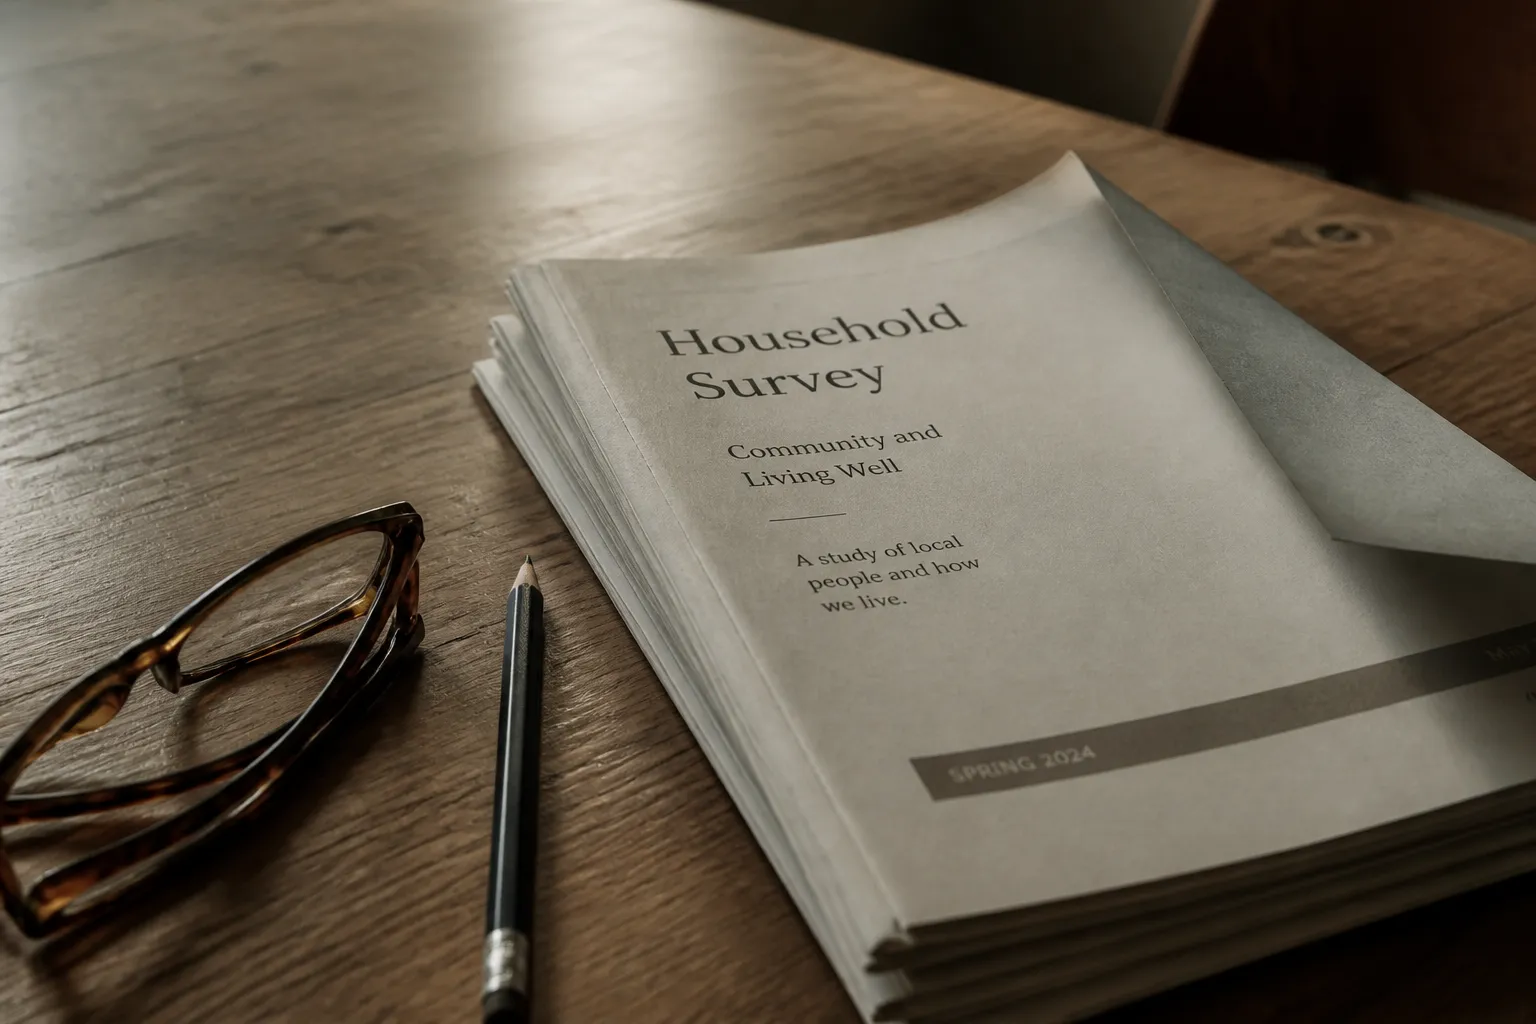
Two numbers can sit side by side in a table and mean different things. One comes from a grocery receipt. The other comes from a government survey of households. The Consumer Expenditure Surveys, or CE, are how you get the second kind, and they are worth learning to read before you hold them up against your own budget.
What the Consumer Expenditure Surveys Measure
The CE is a nationwide household survey run by the U.S. Bureau of Labor Statistics (BLS). It studies how American consumers spend money. The unit being counted is a "consumer unit," which is generally a household. So the figures describe households, not individuals.
There are two parts. In the Interview Survey, households report larger and recurring purchases once a quarter for four quarters in a row. Think rent, car payments, insurance. In the Diary Survey, households write down smaller everyday purchases over two one-week periods. Think the grocery cart. Which part covers a category matters, because the two work differently.
The survey also collects income and demographic details in the same instrument. One source describes it as the only federal effort that gathers spending, income and demographics together, straight from consumers. That is why researchers can ask how spending shifts with income. The results also supply the expenditure weights for the Consumer Price Index, the inflation gauge that tracks how prices change month over month. The data are free to the public. [8]
Finding the Right Data for Your Comparison
Start by deciding what you are comparing. A rent notice in a big metro area tells a different story than one in a rural county. The CE data can be pulled at the national, Census region and metro area levels, with rural and urban breakdowns. Pick the level closest to where you live. [8]
Demographic cuts help too. You can look at age, race and ethnicity, or housing tenure (owners versus renters). Coverage runs from 1980 to the current year, so you can also watch a category's share of spending move over decades. A trend usually says more than one year's snapshot. [8]

Before you match categories, read the glossary. BLS defines terms like "food" and "housing" its own way, and that may not match how you label things at home. The BLS also offers a Tables Getting Started Guide and a Database Getting Started Guide. Both are worth opening first. See the tables guide and the glossary.
Reading the Numbers Without Overreaching
Survey figures are estimates. They come from a sample, so they carry sampling error. A small gap between two years or two groups may be noise. Look for patterns that hold across several years or several related categories.
Averages also hide spread. A few high-spending households can pull a category's average up, so the typical household may spend less than the headline figure. Be wary of building a conclusion on one number.
Then ask a second question: raw dollars or income-adjusted? Because the CE ties spending to income, you can see how it changes as income rises. A group with a higher total does not necessarily spend more in proportion to what it earns. Look at both views. [8]
Comparing Your Own Spending Responsibly
An average is a reference point. It is not a target. Your family size, debts, savings goals and local prices may be far from the survey's typical household. A comparison can show where you run above or below a benchmark. That may prompt a good question. It will not tell you what to spend.
To keep the comparison fair, match your household to the closest breakdown. Use the survey's category definitions. Note the data year, since prices move and an older figure needs context. If you track your own spending for several months, line your categories up with the survey's and see where the gaps sit.
There are limits to what the available sources say. They do not give sample sizes or response rates, and they do not walk through turning a personal budget into a direct comparison. They also stop short of the full list of survey limitations beyond sampling error. Read the complete limitations section on the BLS CE home page before drawing conclusions.
This article is educational only. It is not personal financial, legal or tax advice. For decisions about your own money, consider a qualified professional.
Please seek a professional. This article is general information, not financial, tax or insurance advice. Please seek a licensed financial, tax or insurance professional about your own situation.