A secondary article says ground beef averaged $6.92 a pound in one past August. That sounds like a fact. It is really a lead, because nobody has shown the table behind it. Government price data can settle questions like this, but only if you know which table measures what.
Start with the BLS average price data
The Bureau of Labor Statistics (BLS) publishes average prices, in U.S. dollars, for a selected list of common goods. This is the most direct government source for what consumers actually paid. If you want a past price and not a news summary, begin here. A BLS fact sheet describes the series.
The average price page sits inside the Consumer Price Index (CPI) program. The CPI databases are the wider hub for tracking price changes over time. Use both. One gives you the item. The other gives you the trend around it.
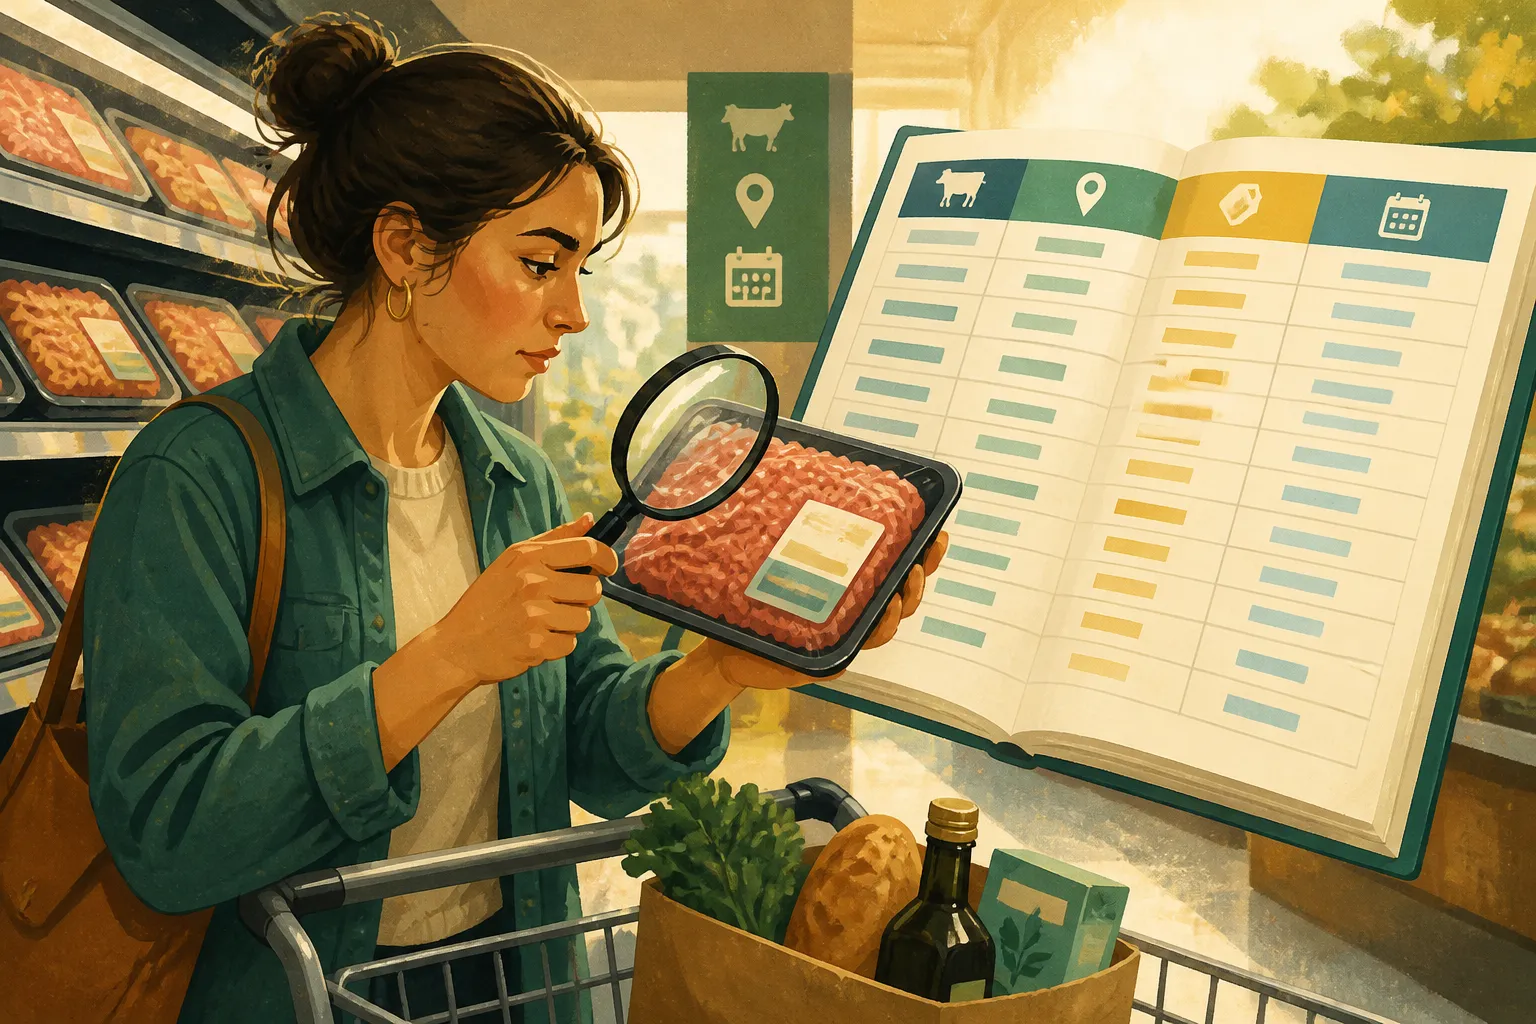
Before you trust a number, check three things: the item name, the unit, and the area. A price per pound is not a price per dozen. A figure for one region is not a national one. Many apparent jumps are just a change in unit or place.
Understand what the CPI measures
The CPI measures the average change over time in prices paid by urban consumers for a representative market basket of goods and services. Note the word change. It does not hand you one universal price for an item. A rising index tells you how fast prices are moving, not what your store charges.
The food portion of the CPI follows retail food prices. That makes it the closest official match to the grocery aisle. It still comes from a sample of items and places, so it shows typical patterns, not the sticker on every package.
Watch the dates, too. Think month over month. A March figure and a June figure only compare cleanly when the item definition and the reporting basis match. The same logic applies to a rent notice: a 5 percent increase means little until you know the base it is measured against.
Separate retail prices, farm-level prices and forecasts
The Producer Price Index (PPI) measures prices received by domestic producers. It does not measure what shoppers pay. When a store price moves, the CPI is usually the right yardstick. The PPI can help explain pressure earlier in the supply chain. Mix them up and the comparison misleads.
Then there are forecasts. The USDA Economic Research Service publishes a Food Price Outlook that projects annual food price changes up to 18 months ahead. It draws on the latest BLS CPI and PPI data. ERS updates it monthly, typically around the 25th, so a figure you read may already be revised.
A forecast is an estimate. One September outlook, as reported by a secondary article, put beef and veal up 9.4% in 2026, with a range of 7.4% to 11.6%. That range matters. It is a projection, not a recorded price. Another report noted an October revision that lifted the fresh fruit forecast from 2.5% to 3%. Revisions run in both directions.
Check secondary articles against the original table
News and industry pieces often summarize government numbers. They may round them, misquote them, or blend a forecast with a measured change. Ask whether the article links the original BLS or ERS table, and whether the date and unit match.
The beef example shows the risk. The article that cited $6.92 a pound also quoted forecast percentages in the same breath. Readers could easily mistake one for the other. Verify the price against the BLS table before using it.
Percentages need the same base as well. One report said retail fresh fruit ran five percent above a year earlier in August, against 1.8 percent for groceries overall. That is a retail year-over-year comparison. A farm-level change or a forecast can use similar words and measure something else.
A simple checklist before you rely on a figure
- Is it a measured past average or a forecast? Past averages come from BLS tables. Expected changes come from ERS outlooks or other projections.
- Do the item, unit, region and period match what you are comparing?
- Can you trace it to a government table? If not, treat it as a secondary report that needs checking.
Know the limits, too. Public tables do not cover every product, store or region. They do not show any one household's spending. The material here also does not explain how BLS picks items or computes averages, so check the BLS methods pages directly. Use these data to understand broad trends and compare like with like. For decisions about your own budget, lease or taxes, rely on official sources or a qualified professional.