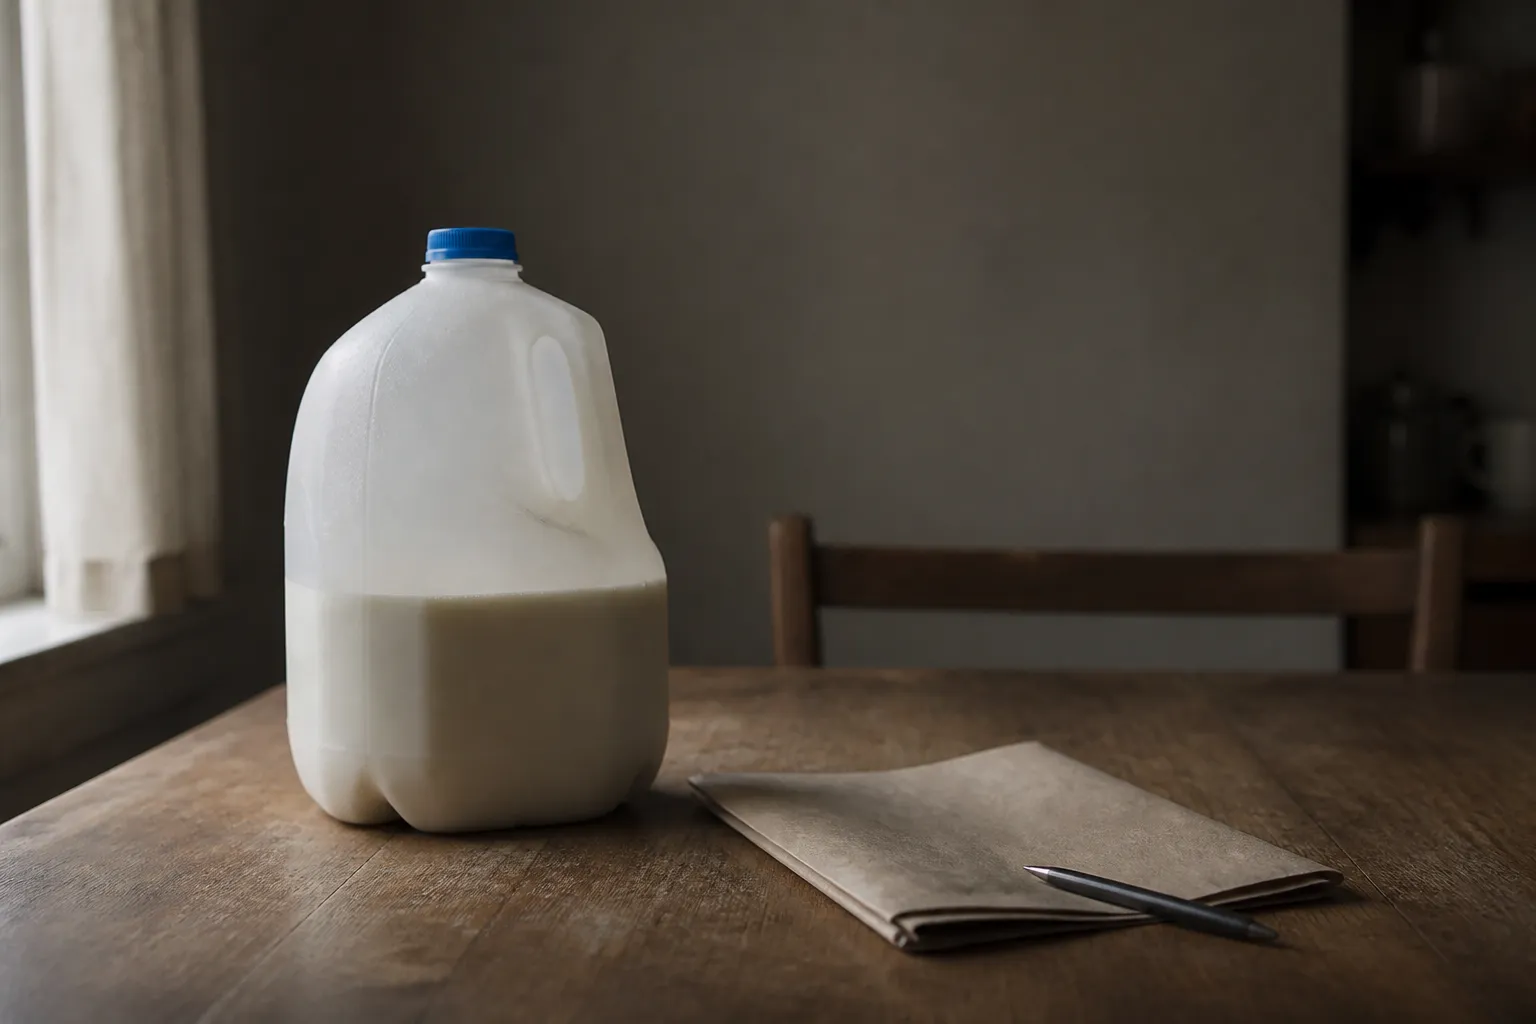









One number, one month, one gallon of milk. That is what an average price series hands you. It is a snapshot, and a snapshot is not a movie.
The Bureau of Labor Statistics (BLS) publishes average prices for a short list of grocery staples. The St. Louis Fed's FRED database carries the milk series. It is easy to read it wrong, so this guide goes through what the number means, what it cannot tell you, and where the supplied material stops short on eggs and coffee.
What an average price series measures
The FRED series for fresh whole milk, fortified, per gallon, U.S. City Average, carries the code APU0000709112. It reports an average price in U.S. dollars for one month. BLS builds these averages from the same prices it collects for the Consumer Price Index (CPI), the government's main gauge of inflation. Field representatives collect non-electricity prices monthly in 75 urban areas.
The unit is a gallon, which is 3.8 liters. The series is not seasonally adjusted, meaning the figures are not smoothed to remove regular calendar patterns. It also blends organic and non-organic milk into one average. If you buy one specific type, this series is not a price tag for your jug. It is a blended reading across many stores and many cartons.
Why one month is a price level, not a trend
The source is direct. Average prices are best used to measure the price level in a particular month, not to measure price change over time. A single reading answers one question: what did milk cost this month? It does not answer whether milk is getting more expensive.
Think of a rent notice. One monthly figure tells you what you owe. It does not tell you the landlord's pattern. You need last year's lease beside it. Grocery data works the same way. A single month can move for reasons the sources do not spell out, such as weather, supply shocks or a local promotion. They also do not explain how seasonal patterns shape one month. So the careful habit is skepticism. One data point is one data point.
Using CPI index values to measure change
For change over time, the source says to use CPI index values for the matching item category. An index compares prices in each month against a base period. That is why it, and not a stack of raw dollar averages, is the tool for tracking change.
The supplied material does not explain how to read an index or turn it into a percentage. For that step, go to the BLS CPI pages directly. The rule still stands without the math. Setting a March average beside a June average and calling the gap inflation is a red flag. It compares levels. It does not measure change in the way the CPI does.
Checking that the comparison is fair
Before you set two numbers side by side, ask three questions. Is the series seasonally adjusted, and does the other figure share that basis? Is the number a one-month level or a measure of change? Does the item match the series definition? Organic versus non-organic milk, or a different package type, may not be interchangeable.
Frequency matters too. FRED links an income series, income after taxes for the lowest 20 percent of households by pre-tax income, drawn from the Consumer Expenditure Surveys. It is annual. The milk series is monthly. You cannot line them up month by month, and the sources offer no practical way to relate them. Any such comparison would be your own analysis, not something these sources establish.
What the source material does not cover
The topic mentions eggs and coffee. The supplied sources contain no egg or coffee series, values, units or month-to-month examples. Nothing here should be read as an egg or coffee price, and none should be inferred from milk.
The two BLS pages supplied are mostly navigation text. Details on sample size, sale-price handling and package-size changes are missing. The BLS average price documentation is the place to check. For your own budget or decisions, consult official sources or a qualified professional. Treat any single month as one input among several.
Quick recap